mynkpdr
I logged my cursor for a month and found a law from 1954
82,866,811 cursor samples in 32 days. The pointer sat still 91.9% of the time, then reproduced Fitts's law from 1954.
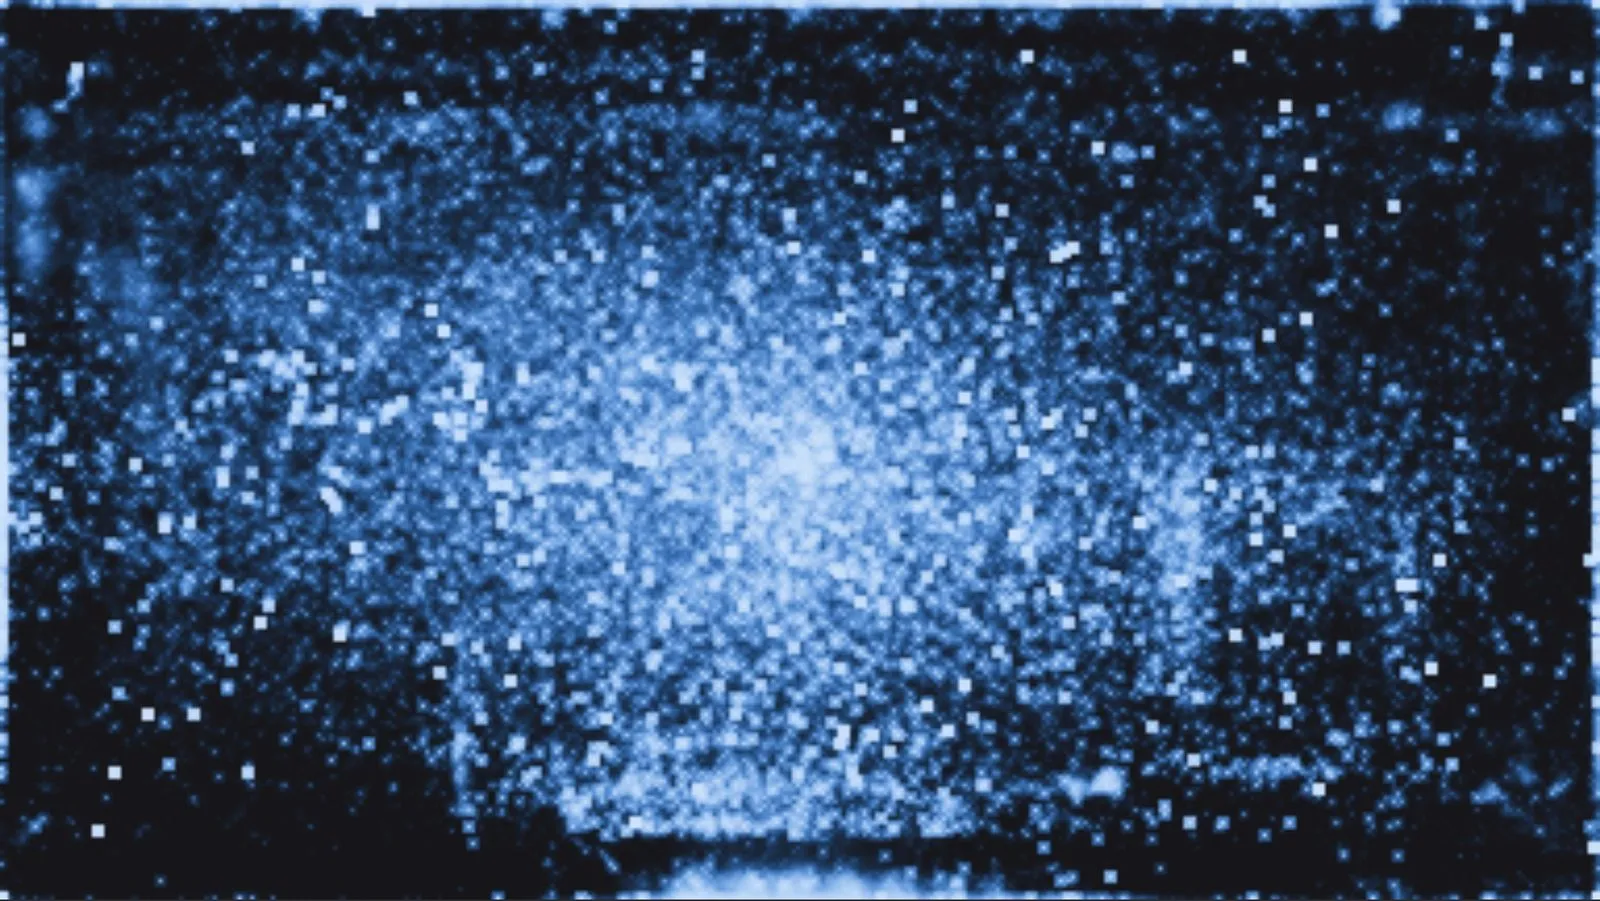
For 32 days I recorded where my mouse pointer was, 144 times a second. That’s 82,866,811 samples, written by a small open-source tool I built called CursorTrack.
What I found
- 91.9% of the samples were the cursor standing perfectly still. Only 5,925,990 landed on a new pixel.
- In a month it travelled 11.91 km and made 85,582 clicks.
- Working at 3 a.m. didn’t make me clumsier. My path efficiency stayed flat all day.
The surprise
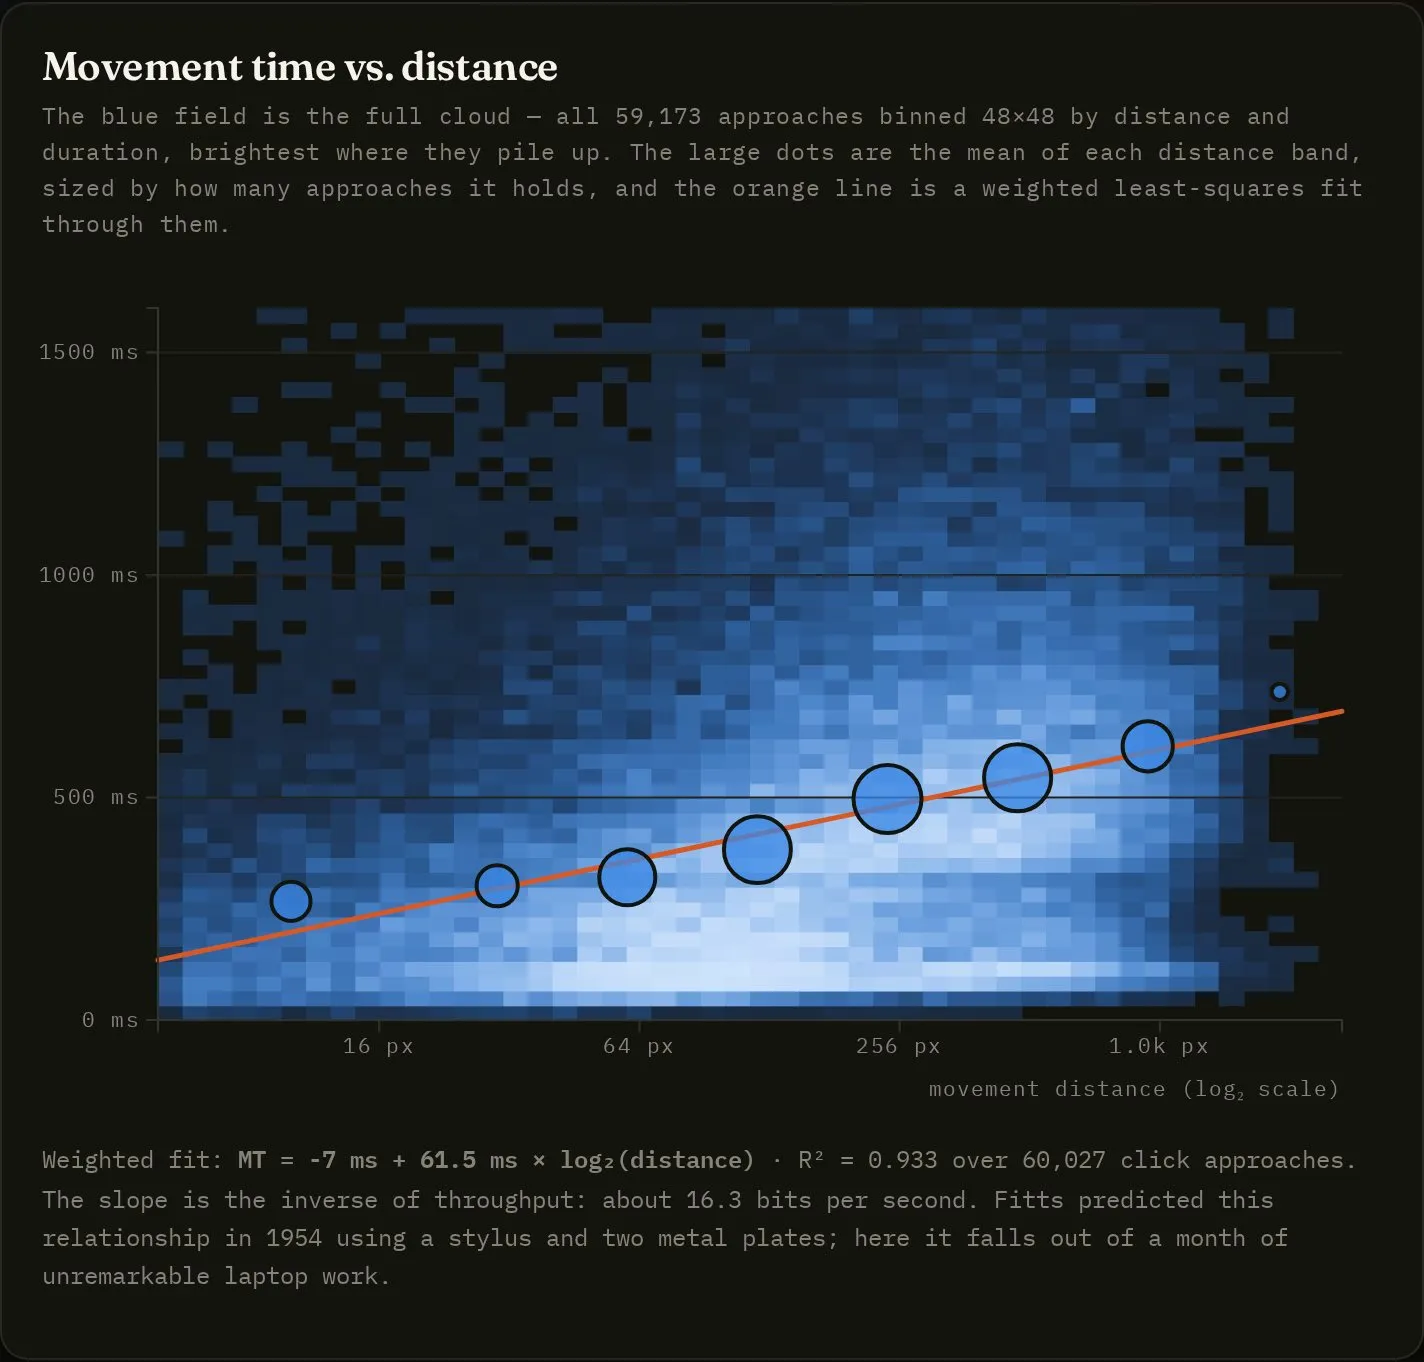
In 1954, Paul Fitts showed that the time to reach a target grows with the logarithm of its distance. I never set out to test it, but my ordinary work reproduced it. Across about 60,000 clicks, every doubling of the distance cost roughly 61.5 milliseconds, with R² = 0.933.
One more thing
Not everything worked. Touch capture produced zero taps because of a bug in my own tool, and I reported that in the story instead of hiding it. No screen contents or keystrokes were recorded, only pointer geometry.